Using digital maps and data for complex decision making at different scales
Using digital maps and data for complex decision making at different scales
Waterdrive WP3.2 team, led by the Swedish University of Agricultural Sciences, SLU.
We are working on the development of a web-based decision support tool. Such tool is needed for transferring complex research data into understandable and usable information accessible to end users at different levels – from decision makers to farmers. Since certain areas tend be most vulnerable to loss of nutrients and pesticides, we need easy-to-use and accessible tools to target such areas, to increase the knowledge among all stakeholders. This will facilitate required interventions and actions.
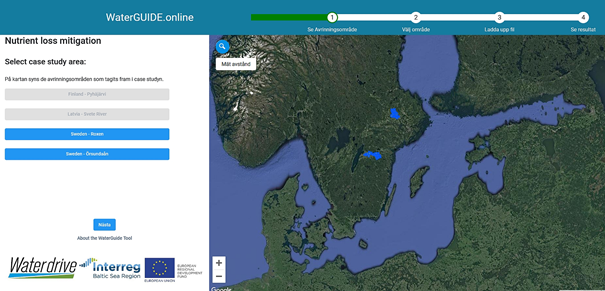
In collaboration between WP3 and WP4 of Waterdrive, we have developed the first version of such a tool. It is freely available at https://waterguide.online/nutrient-loss (Figure 1) (please note that this is a project test website under development which may contain errors and uncertainties, and it may be changed any time – it is intended for use within the project). So far it is available in Swedish language only since the current version covers two areas in Sweden, and it is tested and assessed by authorities, advisors and farmers. The current scale of use is the field level, or even within-field level.
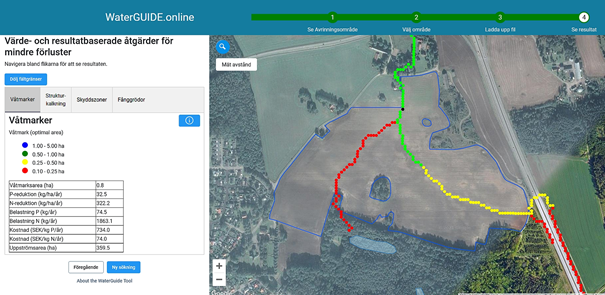
The programming of the system has been carried by DataVäxt AB (Grästorp, Sweden). Functionality and design of this current application have been focusing on results- and value-based localization of mitigation measures pertinent to work carried out by the Swedish Board of Agriculture within WP4. Measures so far include structural liming, localization of wetlands (example in Figure 2), effects of buffer zones and catch crops. The system contains very detailed background data on soils, topsoil clay content, elevation, hydrography and land use, and the user can also upload own data on phosphorus analyses and soil texture data if available to improve accuracy. This background data is combined with modelling output on nutrient loss and effects of various mitigation measures, in some cases downscaling the modelling data to a more detailed level. Methods for data fusion has been developed and automated.
During 2021 we intend to add data on one case study in Finland and one area in Latvia, as well as add English language. Since not all data is available in all case study areas, the functionality will differ to some extent between areas.
Contact: Mats Söderström, SLU ([email protected])