Spatial information and solutions to water management challenges
Spatial information and solutions to water management challenges
Waterdrive WP3.3 team & Sirkka Tattari, hydrologist, Finnish Environment Institute.
All people use maps in one way or other. For example, thematic maps provide valuable spatial and temporal information from the target of interest. A good map works intuitively: at best it explains itself and its functionality, but simultaneously offers a new perspective.
Today the focus of environmental mapping has shifted from small-scale areas such as field plots and forest patterns to larger areas, such as drainage areas and entire river basins. For example, current projects aim to find out where water protection and water management measures work best. Such projects also often promote the networking of actors within the catchment area in order to achieve the objectives set for the project.
By combining different spatial data, thematic maps can be built that give an overall picture of the area’s land use, soil, terrain forms and waters, both surface and groundwater. The catchment areas can be delimited using digital elevation (DEM) data. DEM together with soil and land use data can be used to map flood risk areas, calculate the slope of the fields, and estimate erosion risks. Tools based on spatial data are used to target buffer zones, wetlands, catch crops and other water protection measures to places where they achieve the best benefits for the society. A thematic map can consist also of modelled variables e.g. nutrient loading data. However, from the point of view of practical work, it is always necessary for the user to distinguish which data is based on measured and which ones – on modelled data.
In Work Package 3 we are looking for solutions to shared water problems in the Baltic Sea region (BSR). In WP3.3 Toolbox the challenge is stated in the form of “question”. For example, “How to help municipalities build awareness of the society on spatial development? or How to reduce field erosion or How to reduce diffuse loading and by what means?”. This is followed by a description of the solution and possibility of adapting the solution. Some solutions are presented from the perspective of two countries. There are currently 10 solutions in total and new ones are being collected. In addition to the written solutions, some of the solutions are visualized in a StoryMap which is under construction. It will inspire the use of spatial data sets in water management problems by giving examples.
Countries within the BSR are at different starting points and therefore it is important to highlight and compare current practices. In some countries (e.g., Finland) many spatial data sets are freely available but in some others they are not. In some countries, nutrient leaching modelling (e.g., Sweden) and impact assessments of measures cover the whole country, in others modelling results covering the whole country are still lacking. Some countries have digitized old, accurately mapped data, such as the location of drainage tubes (in Latvia), in other countries this information is not available in modifiable digital format.
Looking towards the scope to achieve better spatial data sets, tools and thematic maps, we still have a lot to learn from each other. The best way to promote good water management is to be open to new ideas. The Waterdrive Project has provided a forum for such discussion. In addition, spatial data sets and earth observation data are constantly improving, which provides a good basis for the further development of various maps and tools.
Figures:
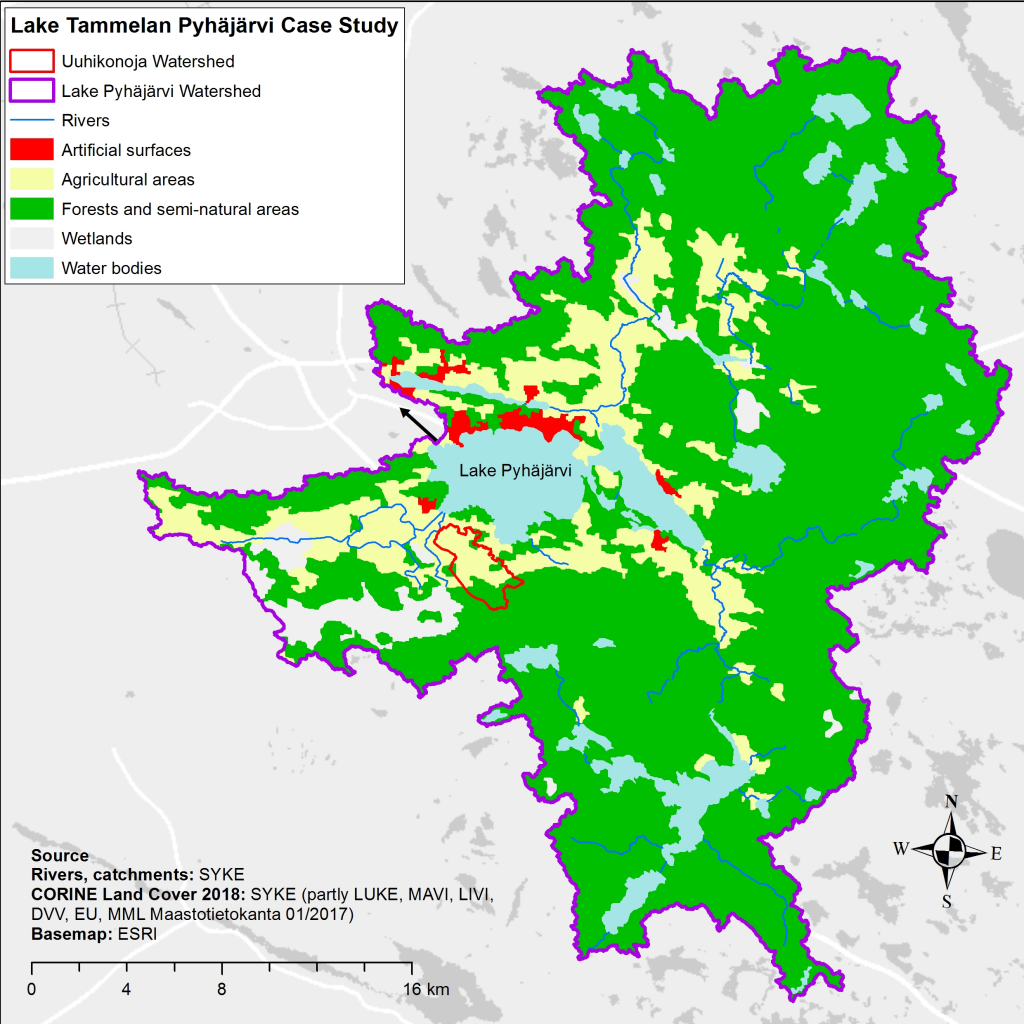
- Delimitation of the small drainage area and the lake Tammela Pyhäjärvi catchment area. The figure also shows land use in the area. Figure: Juha Riihimäki SYKE.
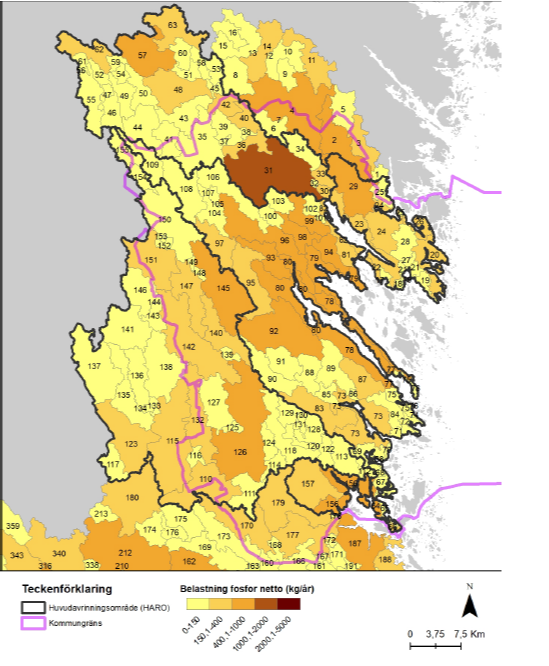
2. Map based phosphorus loading data based on PLC 6-modelling, produced by Econom AB for Västervik Municipality). Purple line is the Västervik Municipality border. Reference: Västervik Municipality, Sweden.